Heber City, Utah

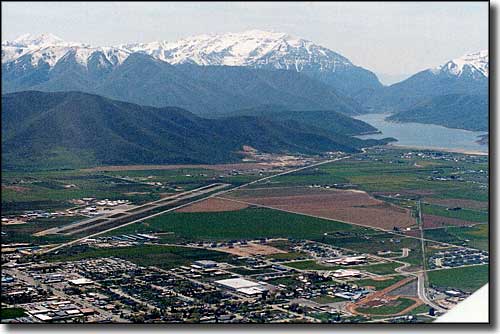
Heber Valley and Deer Creek Reservoir
Heber City was founded by a group of English emigrant Mormon pioneers who named the settlement after Heber C. Kimball, one of the early LDS Apostles. The settlement was originally quite pastoral with most industry centered around dairy farming and cattle ranching but over the years, Heber City has become more and more a bedroom community with almost 30% of the working population commuting to work in Provo, Park City, Orem or Salt Lake City.
Heber Valley has one of the lowest unemployment rates and fastest growing economies in Utah. The population grew about 25% between 2002 and 2008 while home prices doubled during that same period.
Fast Facts about Heber City, Utah
Heber City, Wasatch County, UT 84032
Latitude: 40.5068°N
Longitude: 111.4123°W
Founded: 1859
Elevation: 5,604'
Education:
High School or Higher: 85.2%
Bachelor's Degree or Higher: 24.4%
Graduate or Professional Degree: 5.6%
2011 Cost of Living Index for Heber City: 89.8
Median Resident Age: 28.0 Years
Latitude: 40.5068°N
Longitude: 111.4123°W
Founded: 1859
Elevation: 5,604'
Education:
High School or Higher: 85.2%
Bachelor's Degree or Higher: 24.4%
Graduate or Professional Degree: 5.6%
2011 Cost of Living Index for Heber City: 89.8
Median Resident Age: 28.0 Years
2009 Estimates:
Estimated Median Household Income: $51,100
Estimated Median Home Value: $259,100
Population Density: 2,930 People per Square Mile
Major Industries:
Lodging & Food Services, Construction, Educational Services, Health Care, Professional Services, Retail Services, Government, Finance & Insurance Services, Utilities
Unemployed (March 2011): 8.8%
Population Demographics: 2010
| Total Population | 11,362 |
| Males | 5,744 |
| Females | 5,618 |
| Population by Age | |
| Under 18 | 4,215 |
| 18 & over | 7,147 |
| 20-24 | 643 |
| 25-34 | 1,824 |
| 35-49 | 2,364 |
| 50-64 | 1,326 |
| 65 & over | 720 |
| Population by Ethnicity | |
| Hispanic or Latino | 2,092 |
| Non Hispanic or Latino | 9,270 |
| Population by Race | |
| White | 9,967 |
| African-American | 47 |
| Asian | 121 |
| Native American | 93 |
| Hawaiian or Pacific Islander | 14 |
| Other | 934 |
| Two or more | 186 |
