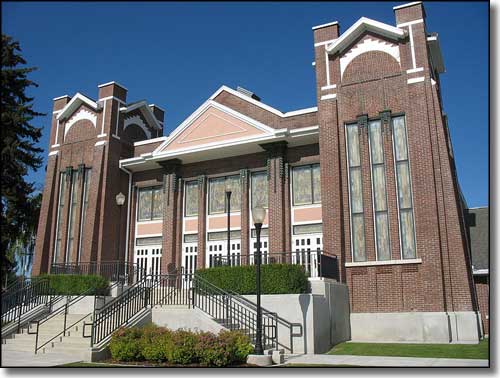
Garland, Utah

The Garland LDS Tabernacle
Garland is another of those small cities located between the I-15 and the Wellsville Mountains in eastern Box Elder County. However, Garland doesn't seem as upscale as some places with median incomes, and home prices in Garland are 20-25% below the Utah medians. It also looks like a lot of the folks work(ed) at the Laz-Y-Boy factory in Tremonton that went through some hard times in 2007-8 (and forced Laz-Y-Boy to relocate all their manufacturing operations to Mexico).
Fast Facts about Garland, Utah
Garland, Box Elder County, UT 84312
Latitude: 41.7329°N
Longitude: 112.1618°W
Elevation: 4,341'
Education:
High School or Higher: 84.0%
Bachelor's Degree or Higher: 13.3%
Graduate or Professional Degree: 2.5%
2011 Cost of Living Index for Garland: 84.3
Median Resident Age: 25.0 Years
Latitude: 41.7329°N
Longitude: 112.1618°W
Elevation: 4,341'
Education:
High School or Higher: 84.0%
Bachelor's Degree or Higher: 13.3%
Graduate or Professional Degree: 2.5%
2011 Cost of Living Index for Garland: 84.3
Median Resident Age: 25.0 Years
2009 Estimates:
Estimated Median Household Income: $49,700
Estimated Median Home Value: $145,650
Population Density: 1,179 People per Square Mile
Major Industries:
Furniture Manufacturing, Transportation Equipment, Educational Services, Construction, Health Care, Miscellaneous Manufacturing, Lodging & Food Services, Computer & Electronic Products, Agriculture, Social Services, Government
Unemployed (March 2011): 9.6%
Population Demographics: 2010
| Total Population | 2,400 |
| Males | 1,201 |
| Females | 1,199 |
| Population by Age | |
| Under 18 | 902 |
| 18 & over | 1,498 |
| 20-24 | 152 |
| 25-34 | 368 |
| 35-49 | 390 |
| 50-64 | 286 |
| 65 & over | 231 |
| Population by Ethnicity | |
| Hispanic or Latino | 241 |
| Non Hispanic or Latino | 2,159 |
| Population by Race | |
| White | 2,187 |
| African-American | 3 |
| Asian | 35 |
| Native American | 13 |
| Hawaiian or Pacific Islander | 1 |
| Other | 118 |
| Two or more | 43 |
