Honeyville, Utah

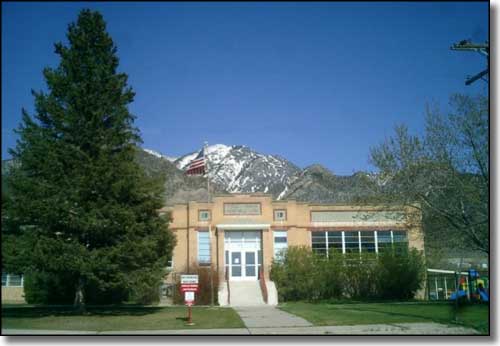
The old Honeyville School
Honeyville is another of those towns in eastern Box Elder County between the I-15 and the Wellsville Mountains. The area was probably first settled in the early 1860's, the first permanent home being built in 1866. The first schoolhouse and meeting hall was built of local stone in 1876 and the first post office was established about the same time. The area was organized as an LDS Ward in 1887 and got the name of Honeyville at that time. Honeyville was granted a town charter in 1911 and became a third class city (under Utah state law) in 1980. Honeyville began as an agricultural town and still is one, however, ground was recently broken on a new geothermal electric generation facility near town.

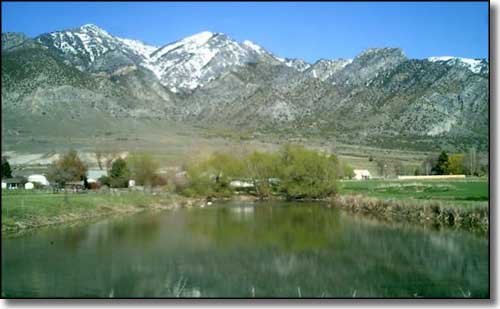
The Wellsville Mountains east of Honeyville
Fast Facts about Honeyville, Utah
Honeyville, Box Elder County, UT 84314
Latitude: 41.6356°N
Longitude: 112.0818°W
Incorporated: 1911
Elevation: 4,298'
Education:
High School or Higher: 86.7%
Bachelor's Degree or Higher: 17.0%
Graduate or Professional Degree: 4.6%
2011 Cost of Living Index for Honeyville: 84.2
Median Resident Age: 29.5 Years
Latitude: 41.6356°N
Longitude: 112.0818°W
Incorporated: 1911
Elevation: 4,298'
Education:
High School or Higher: 86.7%
Bachelor's Degree or Higher: 17.0%
Graduate or Professional Degree: 4.6%
2011 Cost of Living Index for Honeyville: 84.2
Median Resident Age: 29.5 Years
2009 Estimates:
Estimated Median Household Income: $55,500
Estimated Median Home Value: $186,900
Population Density: 118 People per Square Mile
Major Industries:
Transportation Equipment, Educational Services, Lodging & Food Services, Construction, Agriculture, Government, Retail Services, Health Care, Miscellaneous Manufacturing, Social Services
Unemployed (March 2011): 9.6%
Population Demographics: 2010
| Total Population | 1,441 |
| Males | 726 |
| Females | 715 |
| Population by Age | |
| Under 18 | 519 |
| 18 & over | 922 |
| 20-24 | 56 |
| 25-34 | 165 |
| 35-49 | 267 |
| 50-64 | 235 |
| 65 & over | 169 |
| Population by Ethnicity | |
| Hispanic or Latino | 64 |
| Non Hispanic or Latino | 1,377 |
| Population by Race | |
| White | 1,345 |
| African-American | 7 |
| Asian | 25 |
| Native American | 0 |
| Hawaiian or Pacific Islander | 12 |
| Other | 22 |
| Two or more | 30 |
