Sevier County, Utah

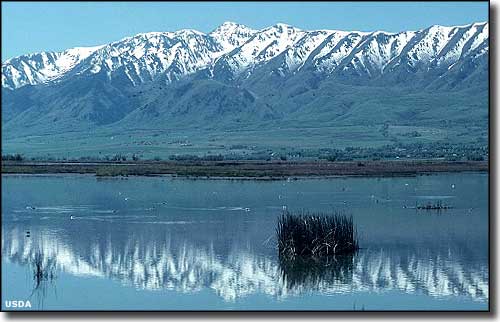
Fish Lake on Fishlake National Forest in Sevier County
Annabella
Aurora
Central Valley
Elsinore
Glenwood
Joseph
Koosharem
Monroe
Redmond
Richfield
Salina
Sigurd
Sevier County is in central Utah, having been split off from the original Sanpete County to the north in 1865. Sevier County contains 1,910 square miles of land and 8 square miles of water. The county seat and largest city is Richfield. The majority of Sevier County is part of Fishlake National Forest.
The first Europeans to enter the area were most likely traveling with the Dominguez-Escalante Expedition, a group trying to find a new route between Santa Fe, New Mexico and the Spanish missions in southern California in 1776. They didn't make it to California but the route they mapped into what is now Sevier County eventually became part of the Old Spanish Trail and was used by fur trappers, outlaws, merchants, government officials and others for a hundred years.
The first Mormon settlers arrived in the Richfield area on June 15, 1864. Most of those frst settlers were of Scandinavian origin and folks in the area are still of predominantly Scandinavian heritage.
Sevier County is crossed by Interstate 70 and it was during construction of that route through Clear Creek Canyon that the Fremont culture artifacts now preserved at Fremont Indian State Park were first discovered.
Private Sector, wages or salary: 72%
Government Sector: 20%
Unincorporated, Self-Employed: 7%
Homemaker, Unpaid: 1%
Population Density: 10 People per Square Mile
2011 Cost of Living Index for Sevier County: 84.2
Median Resident Age: 30.3 Years
Estimated Median Household Income: $43,100
Estimated Median Home Value: $151,300
Major Industries:
Educational Services, Lodging & Food Services, Health Care, Construction, Government, Transportation Services, Agriculture & Forestry, Mining, Retail Services, Social Services, Finance & Insurance Services
Population Demographics: 2010
| Total Population | 20,802 |
| Males | 10,494 |
| Females | 10,308 |
| Population by Age | |
| Under 18 | 6,600 |
| 18 & over | 14,202 |
| 20-24 | 1,076 |
| 25-34 | 2,808 |
| 35-49 | 3,389 |
| 50-64 | 3,368 |
| 65 & over | 3,016 |
| Population by Ethnicity | |
| Hispanic or Latino | 932 |
| Non Hispanic or Latino | 19,870 |
| Population by Race | |
| White | 19,734 |
| African-American | 39 |
| Asian | 67 |
| Native American | 230 |
| Hawaiian or Pacific Islander | 36 |
| Other | 377 |
| Two or more | 319 |
