Torrey, Utah

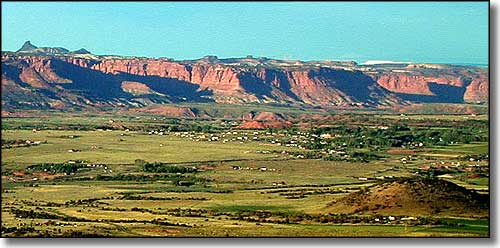
The setting of Torrey, Utah
Youngtown was established in the 1880's by Mormon settlers. Supposedly the name was changed to Torrey in honor of a member of the Wyoming Legislature who proposed the creation of 3 volunteer cavalry regiments of cowboys and stockmen for action in the Spanish-American War. Jay L. Torrey was commissioned as Colonel of the 2nd Regiment but only the 1st Regiment, the famous "Rough Riders," saw action in that war.
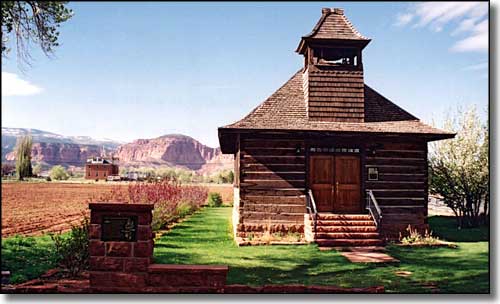
The schoolhouse pictured below was completed in 1898. It was originally built as the meeting house for the local LDS ward but then became the schoolhouse, too. A few years later a sandstone meeting house/schoolhouse was built but the old log building was still in use by the Relief Society (the LDS women's organization), as a voting place and for meetings of the Daughters of Utah Pioneers up into the 1970's. In 1994, a grant from the Utah State Historical Society allowed the building to be moved onto a concrete foundation. As there are very few of these unaltered "initial phase" multiple-use religious/civic/educational structures left in Utah, this is a unique and significant addition to Utah's efforts to preserve the state's early pioneer heritage.

Historic schoolhouse in Torrey, Utah
Latitude: 38.3016°N
Longitude: 111.4199°W
Elevation: 6,837'
Education:
High School or Higher: 89.9%
Bachelor's Degree or Higher: 23.3%
Graduate or Professional Degree: 7.0%
2011 Cost of Living Index for Torrey: 85.7
Median Resident Age: 43.4 Years
Estimated Median Household Income: $31,450
Estimated Median Home Value: $161,900
Population Density: 426 People per Square Mile
Major Industries:
Educational Services, Construction, Lodging & Food Services, Agriculture, Miscellaneous Manufacturing, Mining, Publishing/Motion Picture/Sound Recording, Professional Services, Waste Management Services, Religious Organizations
Unemployed (March 2011): 13.0%
Population Demographics: 2010
| Total Population | 182 |
| Males | 90 |
| Females | 92 |
| Population by Age | |
| Under 18 | 36 |
| 18 & over | 146 |
| 20-24 | 6 |
| 25-34 | 8 |
| 35-49 | 38 |
| 50-64 | 58 |
| 65 & over | 34 |
| Population by Ethnicity | |
| Hispanic or Latino | 18 |
| Non Hispanic or Latino | 164 |
| Population by Race | |
| White | 165 |
| African-American | 0 |
| Asian | 0 |
| Native American | 0 |
| Hawaiian or Pacific Islander | 0 |
| Other | 13 |
| Two or more | 4 |
