Yuma County, Arizona

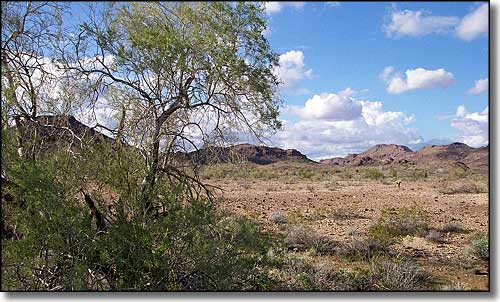
A typical view in Yuma County
Yuma County is in southwest Arizona with California to the west and Mexico to the south. Yuma County contains 5,514 square miles of land and 5 square miles of water. The county seat is Yuma.
If you've ever seen the original Stargate movie, the scenes filmed in the desert sands were filmed around Yuma. Probably half of Yuma County is owned by either the Federal Government or the US Army (for use in weapons testing and desert combat training).

A lot of Yuma County is irrigated farmlands and produces vegetables all year-round
Fast Facts about Yuma County, Arizona
Types of Jobs:
Private Sector, wages or salary: 71%
Government Sector: 22%
Unincorporated, Self-Employed: 6%
Homemaker, Unpaid: 1%
Population Density: 36 People per Square Mile
2011 Cost of Living Index for Yuma County: 85.0
Median Resident Age: 33.9 Years
Private Sector, wages or salary: 71%
Government Sector: 22%
Unincorporated, Self-Employed: 6%
Homemaker, Unpaid: 1%
Population Density: 36 People per Square Mile
2011 Cost of Living Index for Yuma County: 85.0
Median Resident Age: 33.9 Years
2009 Estimates:
Estimated Median Household Income: $38,700
Estimated Median Home Value: $133,800
Major Industries:
Government, Educational Services, Agriculture, Construction, Health Care, Lodging & Food Services, Transportation Services, Social Services, Retail Services, Repair & Maintenance
Estimated Median Household Income: $38,700
Estimated Median Home Value: $133,800
Major Industries:
Government, Educational Services, Agriculture, Construction, Health Care, Lodging & Food Services, Transportation Services, Social Services, Retail Services, Repair & Maintenance
2010 Population Demographics
| Total Population | 195,751 |
| Males | 98,005 |
| Females | 97,746 |
| Population by Age | |
| Under 18 | 55,185 |
| 18 & over | 140,566 |
| 20-24 | 14,708 |
| 25-34 | 24,195 |
| 35-49 | 34,481 |
| 50-64 | 30,089 |
| 65 & over | 30,646 |
| Population by Ethnicity | |
| Hispanic or Latino | 116,912 |
| Non Hispanic or Latino | 78,839 |
| Population by Race | |
| White | 137,881 |
| African-American | 3,931 |
| Asian | 2,324 |
| Native American | 3,056 |
| Hawaiian or Pacific Islander | 306 |
| Other | 40,743 |
| Two or more | 7,510 |
