La Verkin, Utah

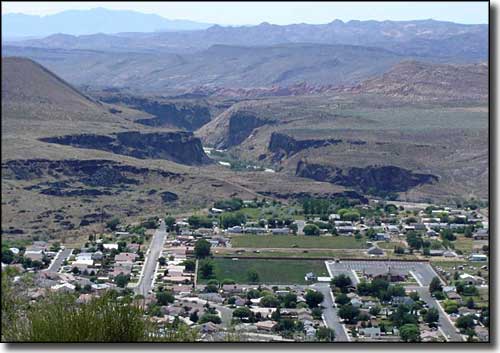
Looking east across La Verkin, toward Zion National Park
La Verkin and Hurricane just about butt up against each other: you can walk from one to the other in just a few minutes. Some folks think the name is a corruption of the Spanish name for the nearby Virgin River while others think it comes from an error in transcribing the Spanish term for "beaver skin."
La Verkin achieved a bit of fame in 2001 when an ordinance was passed by the City Council declaring La Verkin a "United Nations-free zone."
Fast Facts about La Verkin, Utah
La Verkin, Washington County, UT 84745
Latitude: 37.215°N
Longitude: 113.2667°W
Elevation: 3,192'
Education:
High School or Higher: 84.5%
Bachelor's Degree or Higher: 13.8%
Graduate or Professional Degree: 3.2%
2011 Cost of Living Index for La Verkin: 87.8
Median Resident Age: 28.8 Years
Latitude: 37.215°N
Longitude: 113.2667°W
Elevation: 3,192'
Education:
High School or Higher: 84.5%
Bachelor's Degree or Higher: 13.8%
Graduate or Professional Degree: 3.2%
2011 Cost of Living Index for La Verkin: 87.8
Median Resident Age: 28.8 Years
2009 Estimates:
Estimated Median Household Income: $42,500
Estimated Median Home Value: $171,400
Population Density: 271 People per Square Mile
Major Industries:
Lodging & Food Services, Educational Services, Construction, Metal & Metal Products, Health Care, Retail Services, Transportation Services, Finance & Insurance Services, Professional Services, Government
Unemployed (March 2011): 9.6%
Population Demographics: 2010
| Total Population | 4,060 |
| Males | 2,047 |
| Females | 2,013 |
| Population by Age | |
| Under 18 | 1,366 |
| 18 & over | 2,694 |
| 20-24 | 244 |
| 25-34 | 594 |
| 35-49 | 640 |
| 50-64 | 583 |
| 65 & over | 510 |
| Population by Ethnicity | |
| Hispanic or Latino | 345 |
| Non Hispanic or Latino | 3,715 |
| Population by Race | |
| White | 3,712 |
| African-American | 22 |
| Asian | 14 |
| Native American | 61 |
| Hawaiian or Pacific Islander | 14 |
| Other | 131 |
| Two or more | 106 |
