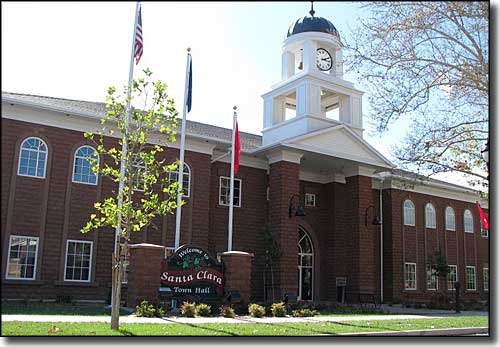
Santa Clara, Utah

Santa Clara City Hall
Located on the Santa Clara River in southwestern Utah, Santa Clara came into being about the same time Jacob Hamblin settled here in 1854. The soil and climate must have been auspicious because, over the years, Santa Clara got a good reputation for its fruit and produce production. There were fruit stands lining the streets of town for many years, up until Interstate 15 was opened to traffic. Nearly all of the fruit stands have disappeared these days. Santa Clara is primarily a bedroom community now as most working folks commute to jobs in nearby St. George.
Fast Facts about Santa Clara, Utah
Santa Clara, Washington County, UT 84765
Latitude: 37.1369°N
Longitude: 113.6492°W
Settled: 1854; Incorporated: 1915
Elevation: 2,762'
Education:
High School or Higher: 94.2%
Bachelor's Degree or Higher: 27.6%
Graduate or Professional Degree: 8.6%
2011 Cost of Living Index for Santa Clara: 88.6
Median Resident Age: 26.0 Years
Latitude: 37.1369°N
Longitude: 113.6492°W
Settled: 1854; Incorporated: 1915
Elevation: 2,762'
Education:
High School or Higher: 94.2%
Bachelor's Degree or Higher: 27.6%
Graduate or Professional Degree: 8.6%
2011 Cost of Living Index for Santa Clara: 88.6
Median Resident Age: 26.0 Years
2009 Estimates:
Estimated Median Household Income: $69,000
Estimated Median Home Value: $280,050
Population Density: 1,393 People per Square Mile
Major Industries:
Educational Services, Health Care, Construction, Lodging & Food Services, Professional Services, Retail Services, Government, Finance & Insurance Services, Real Estate Services
Unemployed (March 2011): 9.6%
Population Demographics: 2010
| Total Population | 6,003 |
| Males | 2,994 |
| Females | 3,009 |
| Population by Age | |
| Under 18 | 2,181 |
| 18 & over | 3,822 |
| 20-24 | 291 |
| 25-34 | 576 |
| 35-49 | 1,093 |
| 50-64 | 984 |
| 65 & over | 685 |
| Population by Ethnicity | |
| Hispanic or Latino | 293 |
| Non Hispanic or Latino | 5,710 |
| Population by Race | |
| White | 5,667 |
| African-American | 26 |
| Asian | 22 |
| Native American | 40 |
| Hawaiian or Pacific Islander | 39 |
| Other | 107 |
| Two or more | 102 |
